
|Articles|December 1, 1999
Oncology NEWS International
- Oncology NEWS International Vol 8 No 12
- Volume 8
- Issue 12
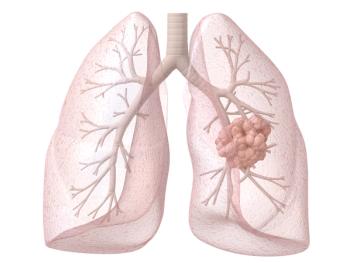
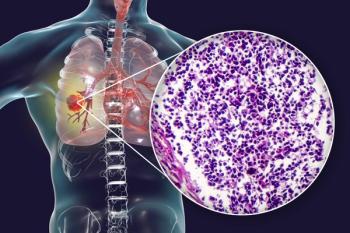
CHART Preferred for Non-Small-Cell Lung Cancer in UK
WASHINGTON-Continuous, hyperfractionated, accelerated radiotherapy, or CHART, has won over official British medicine for the treatment of non-small-cell lung cancer (NSCLC).
Advertisement
WASHINGTONContinuous, hyperfractionated, accelerated radiotherapy, or CHART, has won over official British medicine for the treatment of non-small-cell lung cancer (NSCLC).
In the United Kingdom, CHART is now the treatment of choice in the National Health Service, Mahesh (Max) Parmar, MD, said at the Fall Symposium of the American Society for Therapeutic Radiology and Oncology (ASTRO). The meeting, on advances in NSCLC, was co-sponsored by the American College of Radiology.
Dr. Parmar, of Mount Vernon Hospital, Northwood, Middlesex, England, described the modality as it is used in the United Kingdom and Europe, and presented updated statistics from a 13-center, multinational trial known as the CHART study.
There is only one randomized trial of accelerated fractionation in non-small-cell lung cancer, and that is the CHART trial, Dr. Parmar said. He noted, however, that other accelerated fractionation studies similar to the CHART study are now in progress in the United States and Germany.
The CHART study compared CHART with conventional radiotherapy in 563 patients with locally advanced NSCLC. Between February 19, 1990, and March 31, 1995, the researchers randomized 338 patients to the CHART arm and 225 to the control group.
Males made up 77% of the study participants. Forty-three percent of the patients were between 61 and 70 years of age. Another 26% were age 71 or older. By T stage, 45% were T2, 25% were T3, and 21% were T4.
CHART patients received 54 Gy over 12 straight days, delivered at 1.5 Gy three times a dayat 8 am, 2 pm, and 8 pm. Those in the conventional arm received 60 Gy, given at 2 Gy a day for 6 weeks with no radiation treatments on Saturdays and Sundays.
The Rationale
The rationale for the CHART schedule was to prevent repopulation of cancer cells during the treatment period and to try to get the treatment over and done before any morbidity could kick in and delay therapy, Dr. Parmar said.
The latter objective appeared to work. More than 90% of CHART patients received treatment on time, compared with only 19% of the conventional therapy group, he said.
Endpoints for the study were survival, local tumor control, and disease-free and metastasis-free intervals.
Among the CHART patients, 55% achieved some degree of local tumor control, compared with 45% in the conventional therapy arm.
Local tumor control in non-small-cell lung cancer is a difficult endpoint to assess; its rather subjective, Dr. Parmar said. But at least the subjectivity is similar in both arms. So although I am not sure about the absolute results, the difference between the two arms is probably important.
And, Dr. Parmar added, consistently, CHART seems to provide better local tumor control than conventional chemotherapy. The relative risk of local tumor progression among CHART patients, compared with controls, was 0.79. So, with CHART, we are reducing the relative risk of local tumor progression by about 21%, Dr. Parmar said.
The relative risk of metastasis or death in the two arms was 0.89 in favor of CHART, he added. This is an estimated 11% reduction in relative risk with CHART, but it is certainly not convincing that this is a real effect, he said. Comparing the two arms, you get a hazard ratio of 1.86, representing a reduction in the relative risk of metastatic disease or death of 14% with CHART. Again, this is encouraging evidence, but nothing dramatic.
Improvement in Survival
What is dramatic, he said, is the percentage difference in overall survival across 4 years of follow-up. The hazard ratio was 0.78, representing a reduction in relative risk of death with CHART of 22%, with a P value everybody would like to see (P = .008), Dr. Parmar said.
Four-year overall survival data from the study show that 59% of the CHART patients and 57% of the controls were alive at 1 year. At 2 years, the comparable figures were 31% and 20%; at 3 years, 17% and 10%; and at 4 years, 9% and 4%. The median survival at 2 years was 16.5 months on CHART and 12 months on conventional therapy.
Subgroup Analyses
CHART researchers also looked at various subgroups within the trial population. There is no clear evidence that CHART is more or less effective in T1, T2, T3, or T4 patients, Dr. Parmar commented. All age groups seem to do equally well.
However, when grouped by histology, there is some suggestion that CHART is more effective in squamous cell carcinoma, compared with non-squamous-cell carcinoma, he said. But 85% of the patients in this trial had squamous cell disease. So its no more than an interesting exploratory result, he noted.
The need for analgesia among the two arms varied. Although 5% of patients in both groups required analgesics at the end of the first week after beginning treatment, 30% of CHART patients required them at 2 weeks, compared with a much smaller number in the conventional radiotherapy group, Dr. Parmar said. However, conventional radiotherapy patients required analgesics for a longer period of time.
Dysphagia occurred earlier and was more aggressive in the CHART group than in the control arm, but, at 6 weeks, few or no patients had moderate or severe dysphagia on CHART, Dr. Parma added.
Late morbidity requiring follow-up was 4% in the CHART patients and 6% in the controls. Quality of life studies found no major differences between the two groups. We conclude that there was no radiation myelitis, a low incidence of serious morbidity in both arms, and no difference in the two arms in the proportion of patients with late morbidity, he said. There was, however, a major difference between the two arms in cost, with CHART costing about $1,200 more per patient than conventional radio-therapy.
Articles in this issue
over 26 years ago
SWOG to Study Docetaxel/Estramustine in Advanced Prostate Cancerover 26 years ago
US Smoking Rates No Longer Falling, Due to More Young Smokersover 26 years ago
Americans Favor Higher Cigarette Tax to Balance the Budgetover 26 years ago
Saint Vincents Hospital Opens Comprehensive Cancer Centerover 26 years ago
New Breast Biopsy Techniques Allow ‘One-Stop’ Proceduresover 26 years ago
Director of NCI Mentioned as a Candidate to Head NIHover 26 years ago
Challenges in Designing Chemoprevention Trialsover 26 years ago
Black Women Underrepresented in Breast Cancer Trialsover 26 years ago
UnitedHealthcare Plan Gives Physicians Final Say on Careover 26 years ago
New Agents, Sequential Schedules Hold PromiseNewsletter
Stay up to date on recent advances in the multidisciplinary approach to cancer.
Advertisement
Related Content
Advertisement


Latest CME


Advertisement
Advertisement
Trending on CancerNetwork
1
FDA Approves Zenocutuzumab in NRG1+ Cholangiocarcinoma Post Systemic Therapy
2
Daraxonrasib Shows Anti-Tumor Activity in Pretreated RAS+ Pancreatic Cancer
3
FDA Clears AI Stratification Tool in HR+/HER2– Invasive Breast Cancer
4
Achieving a “Functional Cure” With Multiple Myeloma Therapy
5